Solution Practice Set 5
We'll cover the following
Solution Practice Set 5#
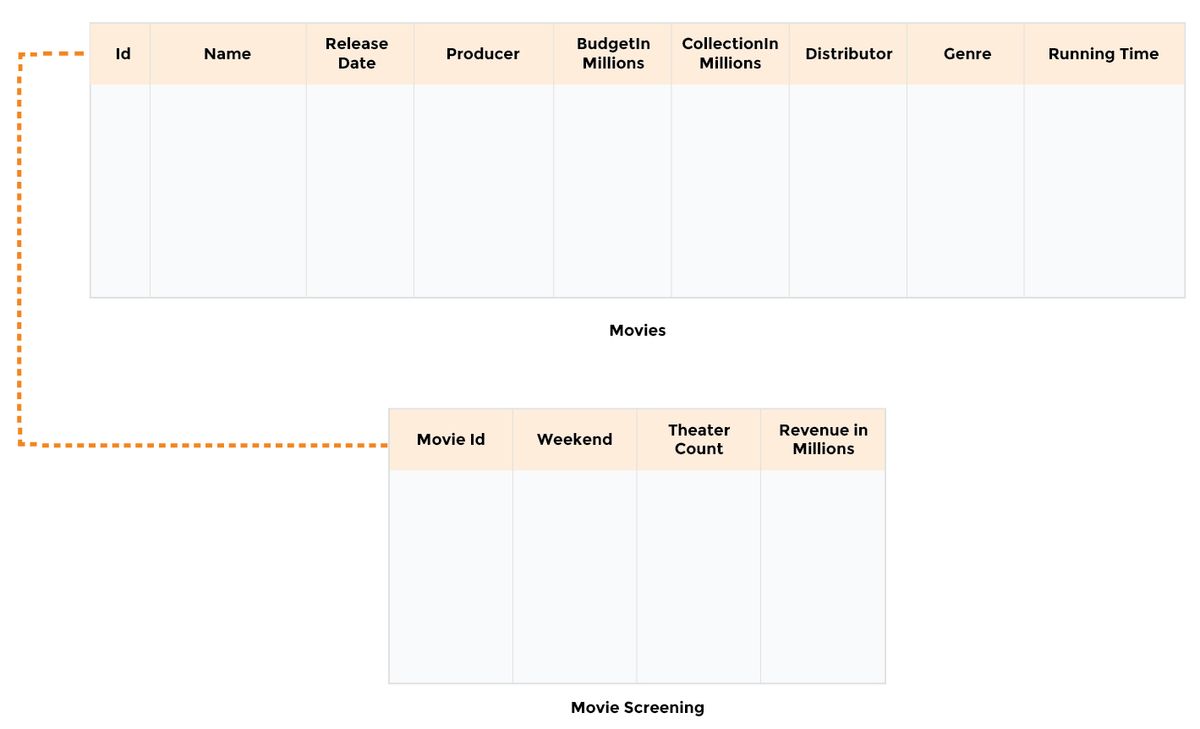
For the purpose of demonstrating analytic functions, we added a new MoviesScreening table and added some columns to the existing Movies table. The relevant portion of the database relationship model is printed below.
Connect to the terminal below by clicking in the widget. Once connected, the command line prompt will show up. Enter or copy and paste the command ./DataJek/Lessons/quiz2.sh and wait for the MySQL prompt to start-up.
Question # 1#
Calculate the running total of the revenue generated per week for the first 10 weeks for the movie Avengers.
Running total provides the summation of the current value and the previous ones and shows the periodic growth of a value. It changes whenever a new value is added. Taking the MovieScreening table into account, for each date, the running total is equal to the previous running total plus the current revenue.
Running total can be easily calculated using the analytical window function SUM() OVER() that has been made available in MySQL 8.0. For previous versions, the same functionality can be emulated using INNER JOINs.
To calculate the running total, we need the MovieId, Weekend, and RevenueInMillions columns from the MovieScreening table. The running total will be calculated using the RevenueInMillions column. The data required to answer this question is shown in the query below:
SELECT Weekend, RevenueInMillions
FROM MovieScreening
WHERE MovieId = 10
ORDER BY Weekend;
To calculate the running total of the revenue, we need to add the revenue of the current row with the previously calculated sum. This can be achieved by joining the MovieScreening table with itself. Since we only need a handful of rows from the MovieScreening table, we will add a join condition on MovieId to ensure that only rows for the movie Avengers are considered:< ON T1.MovieId = T2.MovieId WHERE T1.MovieId = 10
But that alone won’t serve our purpose. We need another join condition to consider only those rows preceding the current row: T1.Weekend >= T2.Weekend
SELECT T1.Weekend, T2.Weekend, T1.RevenueInMillions, T2.RevenueInMillions

FROM MovieScreening T1
INNER JOIN MovieScreening T2

ON T1.MovieId = T2.MovieId
AND T1.Weekend >= T2.Weekend

WHERE T1.MovieId = 10
ORDER BY T1.Weekend, T1.RevenueInMillions;
The output of the above query matches every date to all the preceding dates for the same MovieId. This is shown by the date in the first column being greater than or equal to the date in the second column. The running total will be calculated by adding up the values in the fourth column as shown below:
The final step is applying the SUM function to the appropriate group of rows. The SUM function is used with T2.RevenueInMillions as this column lists all the values for the RevenueInMillion column of the prior rows. The final query is:
SELECT T1.Weekend, T1.RevenueInMillions, SUM(T2.RevenueInMillions) AS RunningTotal

FROM MovieScreening T1
INNER JOIN MovieScreening T2

ON T1.MovieId = T2.MovieId
AND T1.Weekend >= T2.Weekend

WHERE T1.MovieId = 10
GROUP BY T1.Weekend, T1.RevenueInMillions
ORDER BY T1.Weekend, T1.RevenueInMillions;
For the sake of thoroughness, we will show how to accomplish the above task using analytic window function SUM () OVER(). The OVER() clause indicates that this is a window function and not a simple aggregate function.
SELECT Weekend, RevenueInMillions,
       SUM( RevenueInMillions) OVER (ORDER BY Weekend) AS RunningTotal
FROM MovieScreening
GROUP BY Weekend, RevenueInMillions
ORDER BY Weekend;
We specify an ORDER BY element in OVER() clause to define a window. For each row, the window consists of all rows before it as well as the current row. All rows in the window are considered for the SUM() function.
Question # 2#
Calculate the total revenue of each Genre and find the percentage of revenue of each.
For this question we need genre and their total revenue which can be found in the Movies Table. We will calculate the running total and then use it in the percentage calculation. This query can be written using Common Table Expression (CTE) which allows self references offering better readability. Since older versions of MySQL do not offer CTE facility, we will create a view to store our desired data for later access. Other workarounds for achieving the same functionality are temporary tables and derived queries. We will use these options in later questions. Here we are creating a view as follows:
CREATE VIEW CollectionPerGenre AS
SELECT Genre, Sum(CollectionInMillions) as GenreTotal
From Movies
GROUP BY Genre
ORDER BY 2 DESC;

SELECT * FROM CollectionPerGenre;
This query creates a view that lists the total CollectionInMillions for every Genre which can be graphically represented as follows:
Next we will use this view to create a running total of CollectionInMillions column using INNER JOIN as follows:
SELECT T1.Genre, T2.Genre, T1.GenreTotal, T2.GenreTotal

FROM CollectionPerGenre T1
INNER JOIN CollectionPerGenre T2

WHERE T1.GenreTotal <= T2.GenreTotal
GROUP BY T1.Genre, T2.Genre, T1.GenreTotal
ORDER BY T1.GenreTotal DESC, T2.GenreTotal DESC;
Now that we have the data ready for calculating the running total, it is time to apply the aggregate SUM function to the highlighted rows. We will tweak the above query and remove the redundant T2.Genre column from the SELECT and GROUP BY clauses as well as T2.GenreTotal column from the ORDER BY clause. The resulting query is shown below:
SELECT T1.Genre, T1.GenreTotal,
       SUM(T2.GenreTotal) AS RunningTotal

FROM CollectionPerGenre T1
INNER JOIN CollectionPerGenre T2

WHERE T1.GenreTotal <= T2.GenreTotal
GROUP BY T1.Genre, T1.GenreTotal
ORDER BY T1.GenreTotal DESC;
The last task is to calculate the percentage of revenue of each genre. The percentage share of a genre is equal to the running total divided by the sum of all revenue amounts. We will use two derived tables, one for finding the running total and the other to find the sum of all amounts. The query created in the above step will be used as derived table d1.
SELECT  d1.Genre AS Genre,
        d1.GenreTotal AS TotalRevenueInMillions,
        (d1.RunningTotal / d2.TotalSum) * 100 AS PercentageOfTotalRevenues
FROM
( SELECT T1.Genre as Genre,
         T1.GenreTotal AS GenreTotal,
         SUM(T2.GenreTotal) AS RunningTotal

  FROM CollectionPerGenre T1
  INNER JOIN CollectionPerGenre T2

  WHERE T1.GenreTotal <= T2.GenreTotal
  GROUP BY T1.Genre, T1.GenreTotal
  ORDER BY T1.GenreTotal DESC ) d1,

( SELECT SUM(GenreTotal) AS TotalSum
  FROM CollectionPerGenre) d2;
Now we can plot the percentage on top of the bar graph previously created. Percentage of the total revenue of each genre will help us see how each piece contributes to the whole. This can be used in Pareto analysis of different genres to find which is the most profitable. Pareto analysis is a decision making technique which states that a small number of values produce considerable effect overall. The results of this query can be represented graphically as a Pareto chart:
A Pareto chart is a type of histogram that is a combination of a bar graph and a line chart. The height of the bars indicates the contribution of each category to the total and the line represents the percentage of the running total. The above chart shows that the first genre, Action makes up about 86% of the total revenues and the top three genres Action, Thriller, and Reality Television make up about 99% of the revenue. This sort of analysis helps movie makers by showing which types of movies are more profitable.
In the end, we will show how to solve this problem using CTE:
WITH gTotal AS(
  SELECT Genre, SUM(CollectionInMillions) AS Total
  FROM Movies
  GROUP BY 1
  ORDER BY 2 DESC)

SELECT gTotal.Genre, gTotal.Total,
       (SUM(gTotal.Total) OVER(ORDER BY gTotal.Genre) / SUM(RevenueInMillions))*100 AS percentage
FROM gTotal, MovieScreening
GROUP BY gTotal.Genre;
Here the CTE gTotal calculates the total revenue of each genre. It is the same as the view CollectionPerGenre. Unlike views, with CTE it is possible to call gTotal in the same query. SUM() OVER() calculates the running total which is divided by the total CollectionInMillions to find the percentage share of each genre. CTE makes it possible to write a single query for this problem while also improving readability.
Question # 3#
Calculate the moving average of revenue generated in a three week window for the movie Ocean’s 11.
A moving or running average is the average of a subset of the whole data. Moving averages are calculated to rule out short term hikes in the value of a column. They are used to show the long term trend in sales or stock prices and can be used to forecast future values.
To answer this question, we need the following data for the movie Ocean’s 11:
SELECT   Weekend, RevenueInMillions
FROM  MovieScreening
WHERE  MovieId = 5
ORDER BY Weekend;
We need to calculate the average of revenue over the last three weeks. This means that our three week window will change with every row.
The first step is to number the rows according to the Weekend column. The windows analytic function ROW_NUMBER() assigns a sequential value to the rows beginning with 1. This function is available in mysql 8.0. We will show how to achieve the same functionality using session variables. The following query will append a column RowNum to the results of the previous query.
SELECT @counter := @counter + 1 AS RowNum,
       T1.Weekend, T1.RevenueInMillions
FROM MovieScreening T1, (SELECT @counter := 0) c
WHERE MovieId = 5
ORDER BY T1.Weekend;
The SELECT @counter := 0 introduces a variable counter without having to write a separate query. It has the same effect as writing two queries as follows:
SET @counter :=0;

SELECT @counter := @counter + 1 AS RowNum,
       T1.Weekend, T1.RevenueInMillions
FROM MovieScreening T1
WHERE MovieId = 5
ORDER BY T1.Weekend;
The output of this query shows that a RowNum column has been added.
Instead of numbering the rows we could also use the INTERVAL function on the Weekend column to select the previous two rows to calculate the average with the interval under consideration being 14 days.
The next step is to join each row from the above table with two previous rows based on the newly added RowNum column. Two derived tables, table1 and table2 are joined based on the RowNum column. The condition table2.RowNum > table1.RowNum - 3 ensures that for every row, only the previous two rows are included in the result set.
SELECT *
FROM (
       SELECT @counter1 := @counter1+ 1 AS RowNum,
              T1.Weekend, T1.RevenueInMillions
       FROM MovieScreening T1, (SELECT @counter1 := 0) c1
       WHERE MovieId=5
       ORDER BY T1.Weekend ) AS table1
JOIN
( SELECT @counter2 := @counter2 + 1 AS RowNum,
         T2.Weekend, T2.RevenueInMillions
  FROM MovieScreening T2, (SELECT @counter2 := 0) c2
  WHERE MovieId=5
  ORDER BY T2.Weekend ) AS table2

ON table2.RowNum <= table1.RowNum AND table2.RowNum > table1.RowNum - 3
ORDER BY table1.Weekend, table2.Weekend;
As it can be seen from the results, RowNum 3 is joined with numbers 1, 2, and 3. RowNum 4 is joined with numbers 2, 3, and 4 and this pattern continues till RowNum 15 which is joined with numbers 13, 14, and 15. This is equivalent to creating a window of three weeks for every row.
As a final step we will apply the AVG function to the last column to find the average revenue of the last three weeks. We will mention the columns of interest in the SELECT clause and then plug the above query in the FROM clause. The aggregate function results in a GROUP BY clause and the HAVING clause in the last line removes the rows with RowNum 1 and 2 because they are joined with 1 and 2 rows respectively and we only want those rows in our result which provide an average of three week data.
SELECT table1.Weekend AS Weekend,
       table1.RevenueInMillions AS Revenue,
       SUM(table2.RevenueInMillions) AS 3WeekTotal,
       AVG(table2.RevenueInMillions) AS 3WeekAverage
FROM (
       SELECT @counter1 := @counter1+ 1 AS RowNum,
              T1.Weekend, T1.RevenueInMillions
       FROM MovieScreening T1, (SELECT @counter1 := 0) c1
       WHERE MovieId=5
       ORDER BY T1.Weekend ) AS table1

       JOIN

       (SELECT @counter2 := @counter2 + 1 AS RowNum,
               T2.Weekend, T2.RevenueInMillions
        FROM MovieScreening T2, (SELECT @counter2 := 0) c2
        WHERE MovieId=5
        ORDER BY T2.Weekend ) AS table2

        ON table2.RowNum <= table1.RowNum AND table2.RowNum > table1.RowNum - 3

GROUP BY table1.RowNum, table1.Weekend, table1.RevenueInMillions
HAVING COUNT(table1.RowNum) > 2;
If we plot the revenue data and 3 week moving average we can see that moving average has smoothed out bumps in the revenue data. Moving average takes into account previous two week revenues and shows the general trend in revenue data.
For the sake of completeness, we will show how to solve this question using the analytic window function ROW_NUMBER():
SELECT ROW_NUMBER() OVER (ORDER BY Weekend) AS RowNum,
       Weekend AS Weekend,
       RevenueInMillions AS Revenue,
       SUM(RevenueInMillions)  OVER (ORDER BY Weekend ROWS BETWEEN 2 PRECEDING AND CURRENT ROW) AS 3WeekTotal,
       AVG(RevenueInMillions) OVER (ORDER BY Weekend ROWS BETWEEN 2 PRECEDING AND CURRENT ROW) AS 3WeekAverage
FROM MovieScreening
WHERE MovieId = 5;
ROWS BETWEEN 2 PRECEDING AND CURRENT ROW is used to specify the 3 row window for the SUM() and AVG() functions.
Question # 4#
Find the value of RevenueInMillions at the start of each month for the movie Mr. & Mrs. Smith.
By calculating the difference from the beginning, we can see the performance of the movie Mr. & Mrs. Smith in monthly time frames. In MySQL 8.0, the window function FIRST_VALUE() returns the first row from a partition of data. But for older versions of MySQL where this function is not supported, it can be emulated by using workarounds like the aggregated string function GROUP_CONCAT(). This function can create a list of all RevenueInMillions values of the movie ordered by month and we can extract the first value from the string using SUBSTRING() function.
Since we want the revenue value at the start of the month, we need to append the month with each row of the movie. This can be achieved using the following query:
Select Weekend, MONTH(Weekend) As Month, ROUND(RevenueInMillions,2) As Revenue
FROM MovieScreening
Where MovieId = 2;
Next we will group the revenue values by month and create a list of revenue values for every month using the GROUP_CONCAT() function:
SELECT MONTH(Weekend) AS Month, group_concat(ROUND(RevenueInMillions,2))
FROM MovieScreening
WHERE MovieId = 2
GROUP BY MONTH(Weekend);
Once we have a list, it is easy to extract the first value by using the SUBSTRING_INDEX() function. All we need to specify is the delimiter and the number of occurrences of the delimiter (one in our case).
SELECT MONTH(Weekend) AS Month,
       GROUP_CONCAT(ROUND(RevenueInMillions,2)) AS List,
       SUBSTRING_INDEX(GROUP_CONCAT(ROUND(RevenueInMillions,2)),  ',' , 1) AS FirstValue
FROM MovieScreening
WHERE MovieId = 2
GROUP BY MONTH(Weekend);
The final step is to append the first value of the month with every row. We will use the above query as a derived table and join the FirstValue based on the condition in the WHERE clause.
SELECT Weekend As Date, MONTH(Weekend) As Month,
       ROUND(RevenueInMillions,2) As RevenueInMillions, FirstValue
From MovieScreening t1,
     (SELECT MONTH(Weekend) AS Month,
             SUBSTRING_INDEX(GROUP_CONCAT(ROUND(RevenueInMillions,2)),  ',' , 1) AS FirstValue
      FROM MovieScreening
      WHERE MovieId = 2
      GROUP BY MONTH(Weekend) ) t2

WHERE t1.MovieId = 2 AND MONTH(t1.Weekend) = t2.Month;
The result of this query helps put in perspective how much gap we are seeing from the first value of the month. Notice that the first value changes when a new month starts. By calculating the difference from the beginning, we can see the performance of a movie in monthly time frames.
Similarly the last value of the revenue for every month can give an insight into the month by month decrease in its value. To get the last value of RevenueInMillions in a month we can use the same function SUBSTRING_INDEX and specify -1 to traverse the list from the right till the first occurrence of the delimiter.
SELECT MONTH(Weekend) AS Month,
       GROUP_CONCAT(ROUND(RevenueInMillions,2)) As List,
       SUBSTRING_INDEX(GROUP_CONCAT(ROUND(RevenueInMillions,2)),  ',' , -1) AS LastValue
FROM MovieScreening
WHERE MovieId = 2
GROUP BY MONTH(Weekend);
Using the window analytical functions available in MySQL 8.0, the above problem can be solved as follows:
SELECT Weekend AS Date, Month(Weekend) AS Month, RevenueInMillions,
       FIRST_VALUE(RevenueInMillions) OVER (PARTITION BY MONTH(Weekend)) AS FirstValue
FROM MovieScreening
WHERE MOvieId = 2;
Question # 5#
Calculate the monthly growth rate of revenue for the movie Mission Impossible.
Growth rates are used for benchmarking purposes and can be calculated on weekly, monthly, quarterly or yearly basis. To calculate the monthly growth in revenue, first we will group the rows based on month:
SELECT MONTH(Weekend) AS Month, SUM(RevenueInMillions) AS TotalRevenueInMillions
FROM MovieScreening
WHERE MovieId = 3
GROUP BY MONTH(Weekend);
Now that we have generated monthly revenue data, the next step is to calculate the percentage of growth. The formula for growth rate is:
Window analytic function LAG() can find previous rows but in the absence of this function we can use a variable PrevVal to find the value in the previous row. This variable will be updated with the TotalRevenueInMillions value of the previous row as @PrevVal := RunningTotal. The formula of growth rate becomes:
( ( RunningTotal - @PrevVal ) / @PrevVal ) * 100
The query will use two derived queries d1 and d2; one to introduce the variable PrevVal and the other to compute the monthly revenue from the weekly revenue data.
SELECT Month, TotalRevenueInMillions,
       IF(@PrevVal = 0, 0, ROUND(((TotalRevenueInMillions - @PrevVal) / @PrevVal) * 100, 2))  "Growth %",
       @PrevVal := TotalRevenueInMillions
FROM
      ( SELECT @PrevVal := 0) d1,
      ( SELECT MONTH(Weekend) AS Month,
               SUM(RevenueInMillions) as TotalRevenueInMillions
        FROM MovieScreening
        WHERE MovieId = 3
        GROUP BY MONTH(Weekend) ) d2;
If we plot the monthly revenue and growth rate as a bar chart, we can see the decrease in revenue and monthly growth percentage.
In the end, we will show how to use the analytic LAG() function to solve the above question:
SELECT Month(Weekend) AS Month,
       SUM(RevenueInMillions) AS TotalRevenueInMillions,
       100 * (SUM(RevenueInMillions) - LAG (SUM(RevenueInMillions), 1) OVER (ORDER BY MONTH(Weekend))) / LAG (SUM(RevenueInMillions), 1) OVER (ORDER BY MONTH(Weekend)) As Growth
FROM MovieScreening
WHERE MOvieId = 3
GROUP BY Month(Weekend);
The 1 in LAG() function returns the value of SUM(RevenueInMillions) of one row preceding the current row. The ORDER BY clause ensures that the rows are ordered by Month before the LAG() function is applied.
